Home Sales Remain Flat in November
In November, 492 homes exchanged hands via the MLS® (Multiple Listing Service) System of the London and St. Thomas Association of REALTORS® (LSTAR). That was down 19.2%, compared to the same month a year ago, but up 15.5% from November 2023.
“Although down from the previous November, sales were on par with activity in the last four years,” said Dale Marsh, 2025 LSTAR Chair. “Based on the economic climate across the country and the uncertainty in the marketplace, many potential buyers remain on the sidelines. This is evident by the 5.7 months of inventory in November, which is the highest inventory level recorded in the month, over the past 10 years.”
Average sales price remained virtually unchanged from the previous month. It was $604,994 in November, down 5.6% compared to the same time a year ago. In October, average sales price was $605,560.
“Historically, we usually experience a quieter season during the winter months,” Marsh said. “With the amount of inventory available, it may be an opportune time for potential buyers to get into the market. Your local REALTOR® can be a resourceful guide to help those looking to buy or sell a home.”
The table below displays November’s average prices and MLS® HPI Benchmark Prices in LSTAR’s main regions.
| Central Elgin | $657,000 | $658,179 |
| London East | $432,400 | $472,913 |
| London North | $622,100 | $651,863 |
| London South | $560,800 | $625,514 |
| Middlesex Centre | $767,200 | $968,464 |
| St. Thomas | $525,200 | $572,799 |
| Strathroy-Caradoc | $728,400 | $595,768 |
| LSTAR | $559,900 | $604,994 |
The HPI benchmark price reflects the value of a “typical home” as assigned by buyers in a certain area based on various housing attributes, while the average sales price is calculated by adding all the sale prices for homes sold and dividing that total by the number of homes sold. The HPI benchmark price is helpful to gauge trends over time since averages may fluctuate by changes in the mix of sales activity from one month to the next.
The following table displays November’s benchmark prices for all housing types within LSTAR’s jurisdiction and shows how they compare with those recorded in the previous month and three months ago.
| Benchmark Type | November 2025 | Change Over October 2025 | Change Over August 2025 |
| LSTAR Composite | $559,900 | ↓1.0% | ↓2.4% |
| LSTAR Single-Family | $613,300 | ↓0.8% | ↓2.4% |
| LSTAR One Storey | $544,800 | ↓1.5% | ↓3.7% |
| LSTAR Two Storey | $669,600 | ↓0.3% | ↓1.6% |
| LSTAR Townhouse | $459,000 | ↓1.2% | ↓1.7% |
| LSTAR Apartment | $329,900 | ↓3.1% | ↓7.6% |
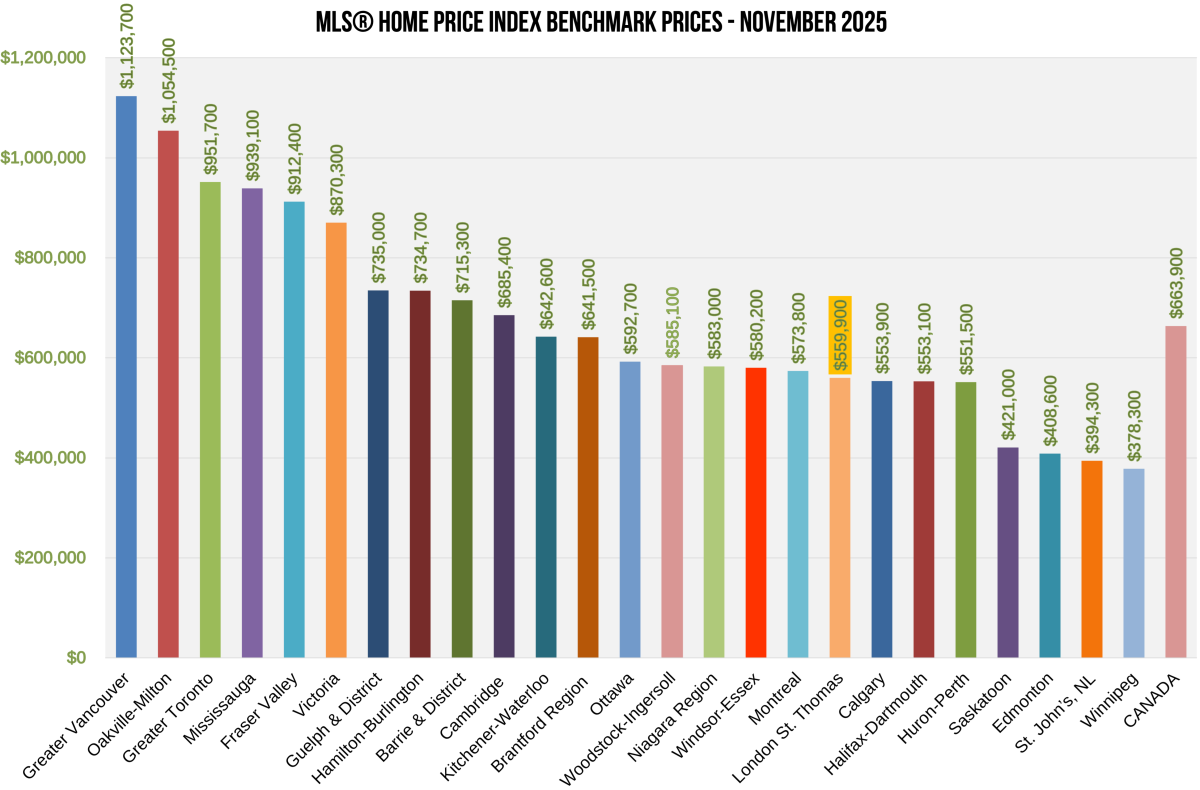
The chart below shows the most recent HPI benchmark prices across the country, courtesy of CREA.